Latest
09 Feb 2022
January prices were high due to high demand and constrained generation
The industry has seen elevated/high prices in January 2022. The Authority signalled this publicly on 13 January and started to dig deeper into why we are seeing unusually high prices for this time of year. Overall, we found that demand was high and supply down compared to previous Januarys.
January prices this year higher than average
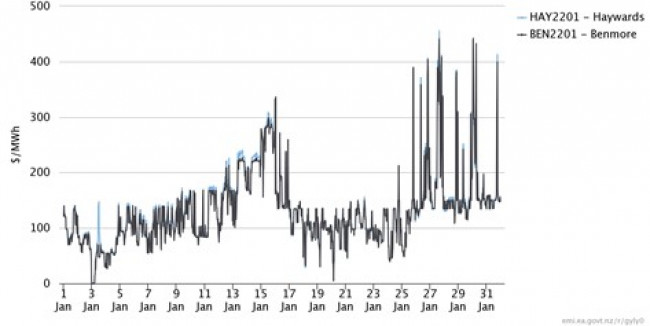
Historically, average prices for the month of January have been under $100/MWh [1]. However, the average price for January 2022 across all nodes was $155.52/MWh. The average price in 2021 for the same period was $134.98/MWh, which was also high. Prices this year have also been more variable, with 95% of prices falling between $5.23/MWh and $348.46/MWh (Figure 1), compared to between $43.01/MWh and $313.92/MWh last year (Figure 2). This is despite overall hydro storage being higher this year than the same time last year – so why are prices higher this year?
The increase in average price in 2022 has come from a combination of factors including above average demand, low wind generation, generation and transmission outages, low hydro inflows and decreasing hydro storage, dry year risk from strengthened La Niña conditions, and tight gas supply which is expected to increase costs of thermal fuels leading up to winter.
Prices were particularly high on 11, 17 and 18 January, spiking to above $300/MWh (Figure 1). This was primarily due to above average thermal peaker generation caused by above average demand and low renewable generation.
Figure 1: January 2022 Spot Prices
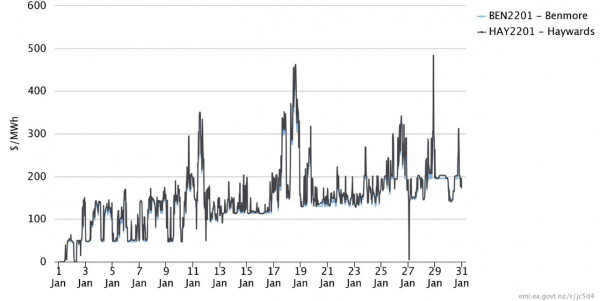
Figure 2: January 2021 Spot Prices
Demand was high due to hot and dry weather conditions
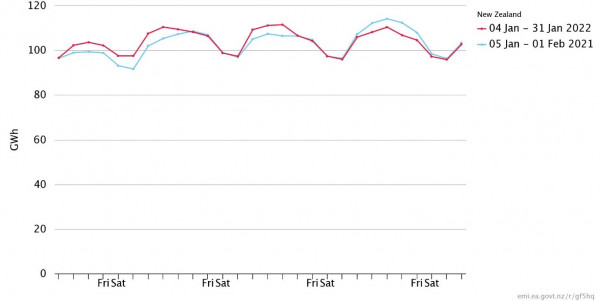
Demand this January has been higher than average due to high amounts of irrigation in the south (100-350MW extra demand in Canterbury/North Otago) and high usage of air conditioning in the north (~200 MW) from hot and dry weather conditions. Compared to the same period in 2021, daily demand on the 11, 17 and 18 January was ~5-8GWh higher in 2022 (Figure 3). However, in the last week of January demand was higher in 2021, with prices reaching above $400/MWh (Figure 2). Demand was lower from 24 January 2022 and may have been due to the country shifting to red under the Covid-19 Protection Framework.
Figure 3: Demand January 2021-2022
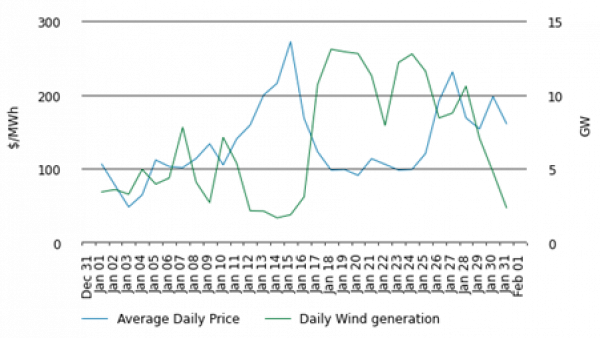
High prices occur when wind generation is low
Wind generation is negatively correlated with prices. In both 2021 and 2022, high prices in January occurred on days when wind generation was low or falling (Figure 4 and 5).
Figure 4: Wind generation and prices January 2022
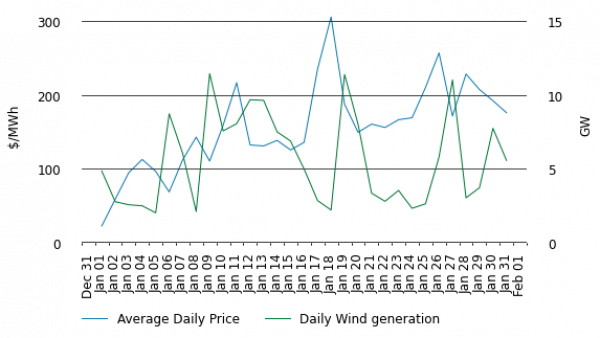
Figure 5: Wind generation and prices January 2021
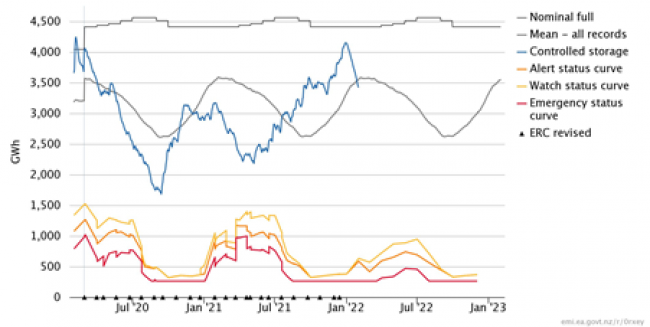
Hydro storage is falling due to low inflows
Hydro storage levels have also been falling due to low hydro inflows (Figure 6). Over January 2022 inflows totalled 1,337.1 GWh, almost half of the historical average of 2,564GWh. In comparison, inflows for January 2021 totalled 2,127.9 GWh.
Total national controlled hydro storage has declined by over 700 GWh from the beginning of January 2022, falling to 100 GWh below average historical levels. In comparison, hydro storage in January 2021 was between 380 and 550 GWh below average historical levels the entire month (Figure 6).
Figure 6: Hydro Storage
The below average inflows are likely a result of strengthened La Niña conditions over December as reported by NIWA in their seasonal climate outlook for January 2022 - March 2022 [2]. During La Niña rainfall in the lower and western South Island is reduced which usually results in below average inflows and storage levels in South Island catchments. In December NIWA said that the likelihood of normal to below average rainfall over major hydro catchment areas over summer increased, with La Niña conditions having an 80 per cent chance of persisting over the first three months, raising the flag for dry year risk. As the effects of climate change become more apparent, with 2021 reportedly the hottest year on record, 2022 and ensuing years are more likely to follow the trend of more extreme weather events increasing the severity of dry years.
Data from Meridian shows snow storage in its Waitaki catchment was at 358 GWh or 80 per cent of historical average on 22 January 2022. However, the majority of inflows from snow melt usually occur in spring, which was when we had significant inflows.
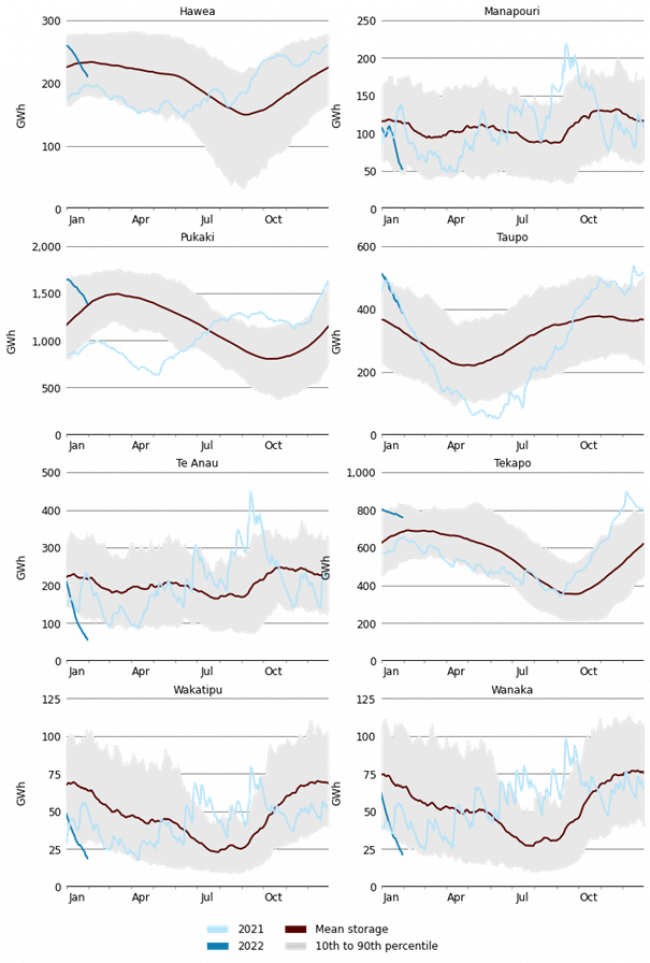
Despite the drop, current total hydro storage is close to average for this time of year. Prior to the recent decrease, high inflows had built up lakes to above or near their 90th percentiles. Examining the storage levels of major lakes against their 10th to 90th percentiles over 2021 to 31 January 2022 in Figure 7 shows the major lakes of Tekapo, Pukaki and Taupo are still at healthy levels.
Lake Taupo storage is high but declining at a similar trajectory as last summer. Inflows during January averaged to 3.4 GWh/day, compared to 6 GWh/day during January last year.
Lakes Wanaka and Wakatipu (which provide about 85% of inflows at Clyde and Roxburgh) are low, below their 10th percentile. While these lakes are uncontrolled storage, outflows at Clyde and Roxburgh must match inflows from these lakes, and inflows are low when lake levels are low.
Figure 7: Hydro storage by reservoir 2021-2022
Since late last year Lake Tekapo has been forced to spill water to avoid going over its maximum operating range of 710.9m above sea level. The build-up of water is a result of Genesis upgrading its Tekapo B station from early October 2021 which has reduced its generation capacity to 80MW, effectively halving its ability to take water. Currently the outage is scheduled to last until 7 Feb 2022. Only in the last couple of weeks has the lake stopped spilling.
Lake Te Anau is facing the opposite situation having hit its minimum operating range of 201.5 metres above sea level due to low inflows. This has reduced inflows into Manapouri., which resulted in lake levels dropping from just below average lake levels to their lowest 10th percentile.
Meridian had to provide flushing flow at Manapouri
Meridian notified the Authority Monitoring team on 26 January 2022 that they expected to hit Manapouri’s low operating range by the end of the week beginning 24 January 2022. When that happens operating guidelines apply that (amongst other things) require Meridian to use its best endeavours to ensure lake drawdown does not exceed the natural rate of drawdown averaged over four days, being 0.05m per day for Lake Manapouri. In this case, with low forecast inflows into Lake Manapouri, this constrains generation from Manapouri to an estimated ~6-6.5GWh per day (a third of Manapouri’s total capacity). Usually to manage the situation Meridian would only shift offered generation into higher priced offer tranches. However due to current market conditions where there are already a high amount of high priced offers being dispatched Meridian intended to also withdraw capacity from the market over the weekend and possibly Monday to maintain full control over drawdown of the lake.
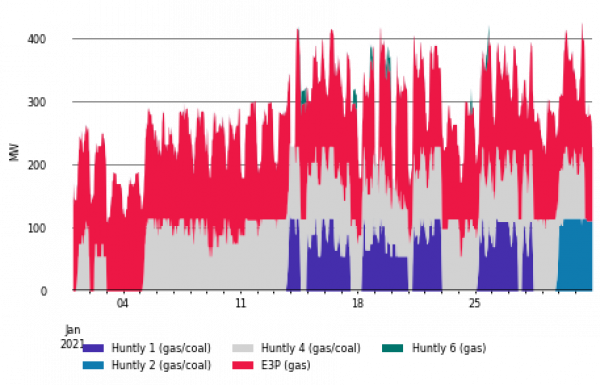
Huntly’s output constrained by river temperatures and gas outage
Increased Waikato River temperatures have restricted Huntly’s ability to run. Huntly Power Station Resource Consent states the maximum temperature of the river 1 km upstream of the Huntly Power Station cooling water outlet is to be 25 degrees Celsius (generally). Genesis informed the Authority that the Waikato river is at record high temperatures (tracking over a degree higher than previous highs at times) and Rankine volume is likely to be curtailed daily throughout January with ongoing issues until March unless there is a change in weather patterns.
As a result Genesis has usually only been running one Rankine unit, especially prior to 24 January (Figure 8). In comparison, in January 2021 two Rankine units were frequently running from about 13 January, with only a few days where they had to reduce the output to one unit due to Waikato river temperatures (Figure 9).
There was also an outage of the Maui Pipeline for repairs which started on the evening of 28 January. Genesis scheduled an outage of the E3P to as there was insufficient gas supply to keep the E3P unit running during the outage. Higher cost generation, mostly North Island hydro, was dispatched to make up the shortfall causing prices to briefly spike above $500/MWh.
Figure 8: Huntly’s generation January 2022
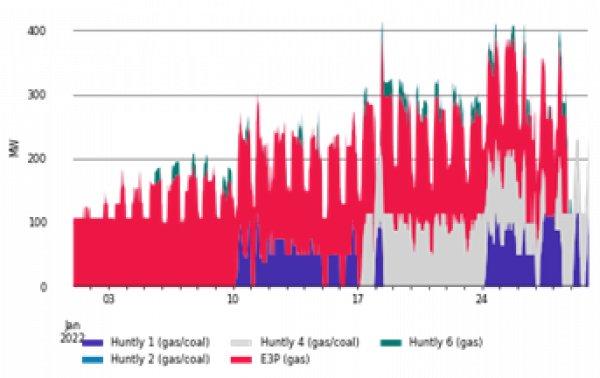
Figure 9: Huntly’s generation January 2021
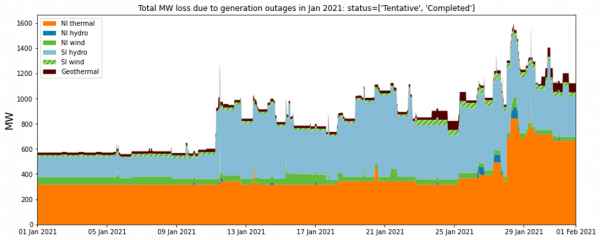
High amounts of generation were on outage
There is also a high amount of generation on outage for maintenance. Generation outages are usually scheduled for the summer months when demand is low and less capacity is needed. However, there is a higher amount on outage this January - frequently over 1250MW (Figure 10) - while last January outages were rarely above 1250MW (Figure 11) except towards the end of the month (when high prices occurred). Some of these outages were likely scheduled to coordinate with transmission outages, such as the Clutha Upper Waitaki Lines project in the lower South Island which began in 2020.
Figure 10: Generation Outages in MW January 2022
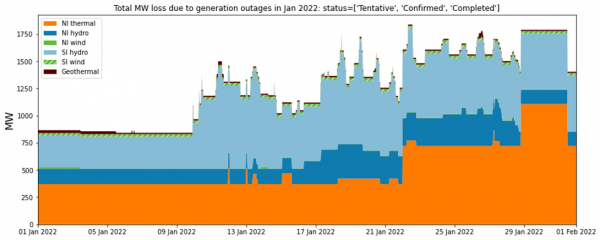
Figure 11: Generation Outages in MW January 2021
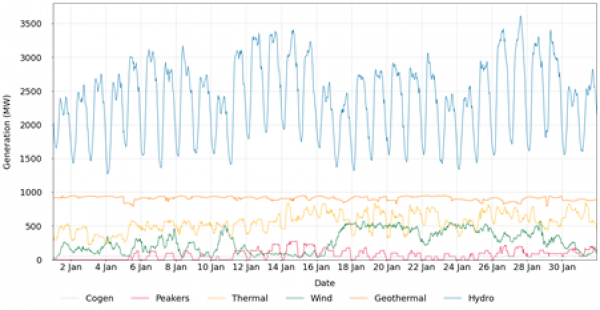
Thermal generation was dispatched to meet demand
When coinciding with periods of low wind generation the restricted hydro and Huntly generation has caused peaker generation to increase. Hydro generation in 2022 (Figure 12) was higher than in 2021 (Figure 13 ) (lake levels were lower in 2021). In turn thermal generation in 2021, particularly from Huntly, was higher. This year output from Huntly has been restricted so generation from Junction Road and Stratford Peaker power plants have increased significantly in 2022.
Figure 12: Generation by Fuel Type January 2022
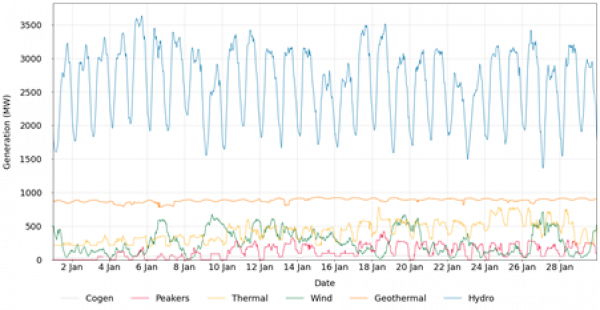
Figure 13: Generation by Fuel Type January 2021
The cost of thermal fuels has increased
High gas prices from restricted local gas production and high coal prices from international coal shortages have increased the SRMC of thermal plants as well as increased the opportunity cost of running thermal generation. With generators wanting to conserve fuel, thermal generation has thus set the marginal premium, explaining the higher average prices seen in 2022.
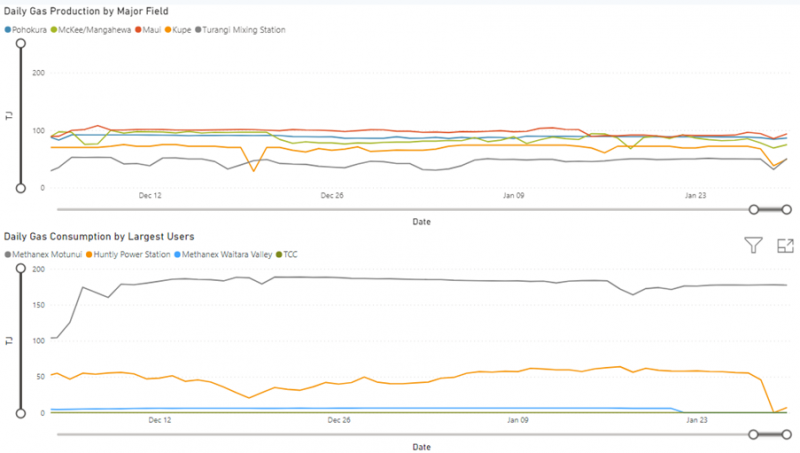
Total production from major gas fields over January has averaged around ~380 TJ/day (Figure 14). Average January gas production from 2019 to 2021 was 402.6 TJ/day for comparison. An unplanned outage on 18 January 2021 dropped production at McKee/Mangahewa by 20 TJ/day.
As gas production levels are unlikely to increase significantly in the next six months should hydro inflows continue as they are currently there is a high possibility we will see a repeat of last year with Genesis invoking its swaption with Methanex as the industry leaned heavily on thermal generation in order to support baseload demand.
Figure 14: Gas Production and Consumption December 2021-January 2022
Carbon unit prices on the secondary market are currently greater than $70/tonne. As approximately ~40 per cent of the price of carbon is added to the final cost of generation for a CCGT and ~50-60 per cent for OCGTs we can expect an additional ~$28/MWh to be added to thermal generation and ~$35/MWh to be added to thermal peaker generation. Added onto the cost of gas we should expect the cost of thermal generation per MWh to at minimum be in the high one hundreds this winter.
Coal and diesel prices have substantially increased over the last year, due to global supply and demand issues, though Genesis buys coal under contract prices. The 2021 closing balance of Genesis’s coal stockpile totalled 835,000 tonnes or 18 PJ which is approximately 5,100 GW, enough for the Rankines to run for a sustained period over winter. This is the highest level of coal stockpiled since December 2014.
Whirinaki is a high cost diesel generator which is intended as a last resort generator to meet peak winter demand. In January 2022 Whirinaki generated 814MWh, predominantly on 18 January. This is three times higher than Whirinaki has generated in any January since 2010, and Whirinaki was not dispatched at all in January 2021.
Why did prices spike so high on 11, 17, 18, 26 and 28 January?
The first price spike seen in January was on 11 January, when prices increased from around $100/MWh to over $300/MWh during the day. The following factors discussed above were also contributing factors on this day - demand was high for January, wind generation dropped significantly during the day, there were several large units on outage at Ohau, Clyde, Roxburgh and Manapouri and only one Rankine unit was able to run due to high river temperatures.
In addition to these factors Manapouri’s generation was much lower than the previous week, even taking into account the outages of two units at Manapouri. This was due to Manapouri needing to provide a flushing flow down the Lower Waiau River for 24 hours on 12 January to assist in managing periphyton biomass (didymo)[3].
On 10 January environmental indice [4] indicated a flushing flow was required on the Lower Waiau River. Execution of a sufficiently large flushing flow [5] requires a high Lake Manapouri level. The lake level was not sufficiently high to achieve this flow at the time and therefore in anticipation of possibly providing such a flow, steps were taken to conserve storage to enable the flushing flow to occur by reducing low-priced offers at Manapouri from 8 to 11 January 2022. This was particularly noticeable on 11 January when only 220 to 328MW was offered in low tranche compared to 550 to 660 MW on 6 January. During this time, Meridian took steps to balance their generation by increasing generation volumes offered at low prices from the Waitaki scheme to offset the reduction in low priced generation volumes offered at Manapouri.
Due to the lower generation at Manapouri as well as outages at Clyde and Roxburgh, the transmission lines Clyde-Roxburgh 2 and Livingstone-Naseby were flowing south. At the same time there was a transmission outage of Clyde-Roxburgh-1 which constrained, forcing generation from Manapouri to increase. Meridian shifted more generation into its lower priced tranches when it realised transmission outages were causing an increase in local demand but it was not enough to lower prices.
Due to the reduction in available generation in the South Island, the HVDC transfer north was low. This increased the demand for North Island generation, increasing prices in the North Island.
On 11 January Mercury offered a total of 912 MW for the majority of the day. In trading periods 20 to 22 there was reduction of total volume offered due to an outage of a Maraetai unit (36MW) which reduced the total offered to 877MW until trading period 23 when the offer volume returned to 912MW. In trading periods 35 and 36 another Maraetai unit (36MW) was returned to service which increased the total offered to 948MW. Unfortunately, this unit was removed from Mercury’s offers in trading period 37 due to issues with the unit and the total hydro offered was reduced back to 912MW. In trading period 40, weed issues at Whakamaru meant offers had to be reduced to 882MWs for the remainder of the 11 Jan. The volume of 912MW was the highest volume offered (excluding the trading periods 35 and 36 on the 11 Jan) until trading period 30 on 14 January when weed issues at Whakamaru were partially resolved increasing the total offered to 943MW. Mercury told us that it sets its offer prices after considering the supply stack, underlying market conditions and its own net position (which in recent times has become heavily influenced by the wind generation output at the Turitea wind farm). On 11 January, these factors resulted in Mercury offering more of its hydro generation at higher prices than later in the week when a maintenance outage at the Turitea wind farm meant there was no generation contribution to the market from that windfarm.
There was an increase in generation from thermal peakers, and Whirinaki was briefly dispatched due to a drop in wind generation.
High prices occurred again on 17 and 18 January 2022 reaching over $450/MWh. On these two days demand was high for January, and wind generation dropped to between 0 and 250MW. There were also several generation outages at Clyde, Roxburgh, Manapouri, Tekapo, Ohau and McKee. Whirinaki was dispatched both days, particularly on 18 January when it ran most of the day, despite being the highest cost thermal peaker.
E3P was not dispatched overnight on 17 and 18 January, but two Rankine units were running at a higher dispatch than E3P usually runs overnight. Huntly 6 started at 6:00am and E3P at 6:30am, which was when the price first increased above $350/MWh. From 7am to about 9:30am Huntly’s output was much higher than normal with two Rankines, E3P and Huntly 6 all running, after which one of the Rankines ramped down, likely due to high river temperatures. It was after this that prices increased above $400/MWh.
The other factor in causing high prices on 17 and 18 January was that hydro generators had increased offer prices as storage levels continue to decline. For example, Mercury increased their highest tranche from just over $400/MWh to $500/MWh on 18 January. Mercury has indicated that the quantity in their highest tranche would require inefficient operation of their units to dispatch which increases maintenance costs. Therefore, they may have increased the price of this tranche to reduce the likelihood of needing to run their plant inefficiently.
Prices on 26 January 2022 were due to above average demand and similarly as above, high-priced generation being dispatched. Falling wind and Huntly generation resulted in high priced hydro offers being dispatched. Demand was possibly higher on the day due to the recent nationwide shift to red (there has been a trend following shifts in alert levels where daily demand spikes). With business still being open but people advised to work from home we may possibly see a rise in residential consumption while commercial consumption remains the same.
The price spike on 28 January 2022 occurred between 9-9:30pm and was primarily due to expensive North Island hydro generation being dispatched following the loss of Huntly’s e3p gas powered unit. Huntly had closed its e3p unit due to scheduled repair work being carried on the Māui gas pipeline by Firstgas. As it was Auckland Anniversary weekend it was considered the best time to put the pipeline on outage. While the system adjusted to the loss North Island hydro ran particularly hard with schemes at Patea, Whakamaru and Waipapa running the hardest at maximum capacity. As hydro generation was priced highly due to declining hydro storage and generators appearing to be concerned over dry year risk this drove spot prices to above $500/MWh.
Are these prices consistent with competition?
The above analysis indicates that the recent high prices are consistent with underlying conditions and are likely to continue until there are significant hydro inflows. In terms of the price spikes signalled for further investigation in the weekly trading conduct reports (11, 17 and 18 January), we have found no evidence to suggest a referral to the compliance team of any behaviour by any generator. However, as with the competition review, there is still ambiguity in assessing whether the overall level of recent prices compared to historical levels are consistent with competitive outcomes. This is because we cannot account perfectly for gas supply uncertainty. That is, what risk premium should be added to the short run marginal cost (SRMC) of thermal generators and what impact this has on water values with thermal often being the marginal price setter for hydro generation. We will continue to monitor the situation closely. A review of price outcomes under the new trading conduct rule will be undertaken in the future once we have sufficient data to look at a longer timeframe, comparing offers and prices before and after the implementation of the new rule.
[1] Based on data from 2010 to 2018
[2] https://niwa.co.nz/climate/seasonal-climate-outlook/seasonal-climate-outlook-january-2022-march-2022
[3] Since the arrival of didymo in the Waiau Catchment in 2004 Meridian has funded extensive monitoring of nuisance periphyton biomass in the Lower Waiau River. As part of a 2010 consenting process, a flushing flow protocol was required to be developed to manage nuisance periphyton as a condition of the consent.
[4] Traffic light indices for periphyton management have been developed by NIWA specifically for the Lower Waiau River. The traffic lights are green (all is well), amber (a supplementary flow response should be considered) and red (a supplementary flow response is required).
[5] flow peak of >160m3/s and mean flow of 120m3/s over 24 hours
27 Mar 2023
HVDC inter-island cable: Benmore to Haywards
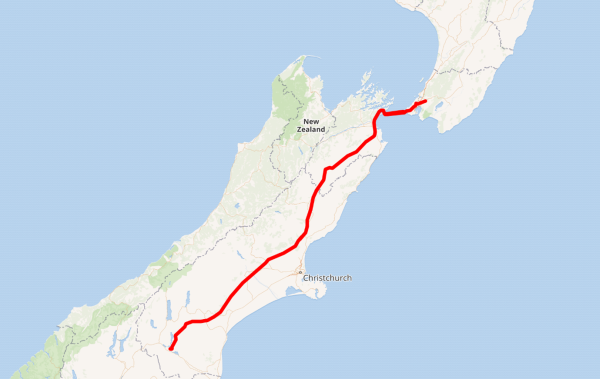
The path of the HVDC running from Benmore in the South Island to Haywards in the North Island
The high-voltage direct current cables (HVDC) electrically link the North and South Islands of New Zealand and are a vital piece of national infrastructure. These cables allow electricity produced in either island to flow to the other. Since the North Island is more populated, and therefore consumes more electricity, the HVDC typically transfers electricity northward during the day and southwards overnight. This pattern can differ, for example when South Island lake levels are low and or when North Island wind generation is high.
These cables also provide ‘security of electricity supply’1 in both islands, especially in winter when electricity demand is high. Electricity in the South Island can become constrained when the hydro lakes are low, and importing electricity from the North is needed to meet demand. Alternatively, if North Island wind generation is low, or other generation unexpectedly trips, more South Island hydroelectricity is brought North.
The first set of cables were known as pole 1 and was commissioned in 1965 to transfer 600 MW. Pole 1 stretched over 600 km, beginning at Benmore dam in Canterbury and ending at Haywards in Wellington. Most of the link consisted of overland transmission and then submarine cables along the Cook Strait. A second link, pole 2, was added in 1992. In 2012 pole 1 was retired and replaced with pole 3 in 2013. Together, pole 2 and pole 3 can transfer a maximum of 1050 MW northwards and 750 MW southwards.
Every year, pole 2 and 3 must undergo maintenance to ensure their continued reliability. Since 2019, maintenance occurs in February2 as demand for electricity is lower in summer and it is less likely to be disruptive to the electricity grid. This year, the outage spanned from 23 February to 6 March3, with at least one pole out during that time. During the weekend of 25-26 February, both poles went on outage, which electrically disconnected the islands. This caused price separation4 to occur. Prices were around $1/MWh in the South Island, as there was abundant hydro generation and less demand. At the same time, prices were around $150/MWh in the North Island, as thermal generation was needed to meet demand. Price separation is a legitimate market phenomenon, which reflects the underlying electricity market conditions in each island.
Some South Island hydro generators also schedule maintenance outages to coincide with the HVDC outage in February, as requirements for their electricity is low when it can’t be transported north. In comparison, the North Island hydro generators conserve water before the HVDC outage, as they need to meet North Island demand.
The Electricity Authority monitors the amount of electricity flowing between each island, and how this impacts electricity spot prices and market dynamics. Read our weekly trading conduct reports. More information and real-time HVDC flows can be found on our EMI website and on Transpower’s website.
1. What is security of supply?
2. Previously this occurred in November.
3. A second pole 2 outage is also occurring between March 21-30 March
27 Feb 2023
The impact of our climate on hydro generation
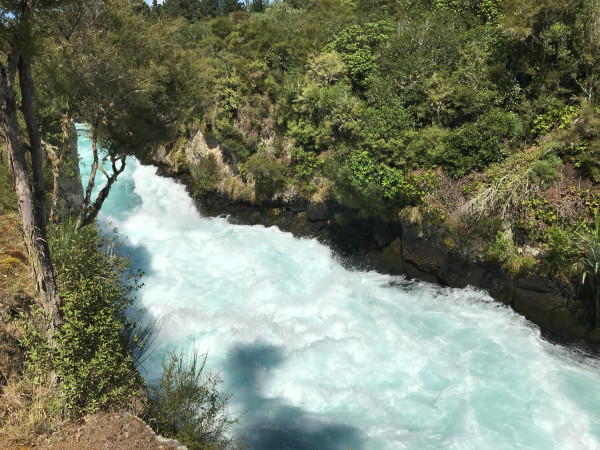
Waikato River
Over 50% of New Zealand’s electricity is produced by hydro power. New Zealand’s largest hydro schemes, the Waitaki and Manapōuri, are in the South Island. While there are hydro dams in the North Island, these schemes have a smaller capacity. Since the North Island has higher electricity demand, the South Island generated electricity is often transported north via the HVDC inter-island cable.
In January 2023, the oceanic and atmospheric phenomenon known as La Niña, contributed to dry weather in the South Island, and wet conditions across the upper half of the North Island. Lakes Manapōuri and Te Anau experienced their lowest January inflows since 1953, while Lake Taupō recorded its fourth highest January inflow. This ‘wet dry divide’ impacted hydro storage and generation across the country.
Until early February this year, low rainfall in the South saw hydro storage in lakes Manapōuri and Te Anau drop below their low-operating ranges. Meridian, who operate Manapōuri power station, then had strict limits on how quickly the lake levels could drop further. This reduced their ability to generate electricity.
In contrast, heavy rain in the North Island saw Lake Taupō’s storage reach its maximum agreed limit. Mercury had to spill water downstream into the Waikato River, in line with resource consent requirements with Waikato Regional Council. This was controlled, due to heavy rain and to prevent further flooding downstream. During the heavy rain, Karāpiro dam outflows were above 500 cubic metres per second, resulting in some minor flooding in Hamilton.
Mercury has nine hydro generation dams on the Waikato River, with additional streams also supplying more water at various points in the chain. Each dam has a different amount of water that can be stored directly above it (see Figure 1). It takes about 24 hours before water released from Lake Taupō reaches the final dam at Karāpiro. No one event may be the same in terms of how much water is flowing in from which streams.
Mercury must carefully manage these many complexities when deciding how much water to release from Lake Taupō, how much and when to generate from each dam, and how much they might need to spill at Karāpiro - all while complying with various resource consents.
With plenty of water in the North Island, and restrictions on water usage in the South, there were high transfers of electricity southwards across the HVDC cable. Mercury generated a total of 414 GWh in January from its Waikato hydro stations – the highest over the previous nine years (during January) was 332 GWh. Southwards flows over the HVDC reached above 400 MW at some points (see Figure 2).
In the previous nine years, only one other had southward HVDC flows which reached higher than those seen in January 2023. This occurred in 2018, when there were extreme weather events in the North Island in January and low hydro storage in the South Island.
NIWA forecasts that La Niña conditions1 will continue over the next few months. New Zealand’s extreme conditions may therefore persist, which will impact hydro storage and generation. Climate change may also mean these extreme events become more common in the future.
The Electricity Authority regularly monitors New Zealand’s hydro generation and storage. View our EMI website.

Figure 1: Waikato hydro system and relative storage
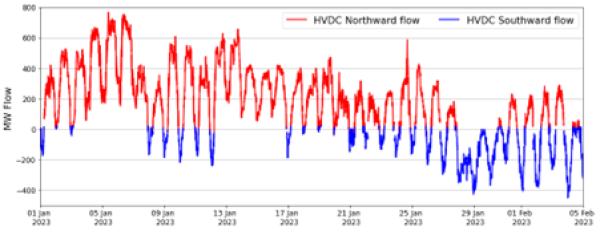
Figure 2: HVDC flows between 1 January – 5 February 2023
2. Note gaps in the figure are a feature of the plotting – not zero MW HVDC flows.
14 Feb 2023
New Zealand's electricity future: generation and future prices

New Zealand’s future is electric. More electricity generation is needed to meet increasing demand and to replace fossil fuel-fired generation. Increasing electricity generation will also enable the decarbonisation of the economy – which is needed to meet New Zealand’s climate goals.
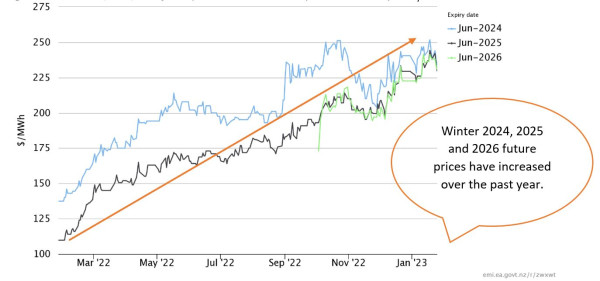
Despite the building of more renewable generation, future prices[1] for winter 2024, 2025 and 2026 remain high (see figure 1). However, more renewable generation should act to depress spot prices in the long run, as they produce cheaper electricity. So why are near-term winter future prices high?
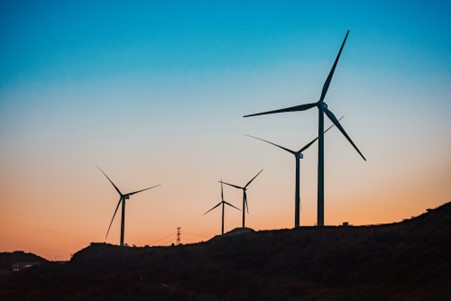
Contact Energy's Tauhara 2 geothermal power station under construction in July 2022
There is ~2,600 GWh/year of new renewable electricity generation3 expected to be online between now and 2026. This will be mostly solar farms, followed by wind turbines and geothermal. Doubt, however, around commissioning times is increasing. Many build projects are facing covid-induced supply chain issues, long consenting times and increasing costs. Hence, there is growing uncertainty about what generation will be online for each winter.
During winter peak demand, New Zealand consumes the highest volumes of electricity. In recent years, situations have occurred where available electricity supply has been quite tight.4 Electricity spot prices during these times are generally high, as expensive fossil-fuelled generation is needed to meet high demand.
Most new renewable generation is intermittent. Wind and solar farms cannot be relied on to cover winter peaks, as it could be dark, windless or cloudy. Therefore, until large-scale energy storage is available (which stores excess energy from intermittent generation), or demand flexibility becomes more prevalent, fossil-fuelled generation will remain available to meet winter demand. Furthermore, many fossil-fuelled power stations are approaching retirement and requiring more maintenance, which adds extra costs. Last year, Contact Energy announced that it will retire TCC5 in 2024. This might see Huntly’s more expensive Rankine units running more often, especially over winter.
Compounding this, future gas supply also remains uncertain and coal prices kept increasing over 2022. Coal prices are forecast to stay high, and carbon prices will also increase. These uncertainties, alongside expectations of increasing costs of running fossil-fuelled plants, have likely contributed to the increase in futures prices over 2022.
Committed new renewable generation is enough to meet projected demand growth. However, it is unlikely sufficient to displace all fossil-fuelled generation. This shortfall in renewable investment is likely to keep fossil-fuelled generation in the market, to avoid electricity shortages. Hence spot prices will remain high, as indicated by the predicted winter 2023, 2024 and 2025 futures prices.
Transpower monitors new connection enquiries to the electricity grid. Using its dashboard, you can see what regions have high volumes of enquiries, and filter between different types of network connections, including generation, energy storage and network upgrades.
In our Wholesale Market Review, we proposed to increase our monitoring of new generation to better ensure the efficient, reliable, and competitive operation of Aotearoa's electricity market. Thanks to all those who made a submission. We are currently assessing our proposal in light of your submissions and will then publish our decision on this website.
1. Read our explainer: The forward electricity market explained
2. Future prices came down slightly between 25 January – 8 February 2023, however, the overall trend is still increasing.
[3] This is generation which has been ‘committed’ ie, the unconditional final investment decision has been made. However, there are other projects which are being actively pursued, but are less likely to be online by the end of 2026. For more information, read this generation investment survey.
[4] The Electricity Authority is investigating ways to promote consumer interests during periods of peak demand in winter 2023, see our consultation paper: Driving efficient solutions to promote consumer interests through winter 2023.
[5] A large gas fired power station.
31 Jan 2023
Eye on Electricity: The electricity system in December 2019 versus December 2022
December 2022 was the end of an immense year in the electricity sector.

Fig. 1: Benmore dam in December 2022
December 2022 was the end of an immense year in the electricity sector. A dry summer and autumn, which saw hydro lakes levels plummet over several months, was juxtaposed by a wet and windy winter and spring (see Figure 2). Rain and snow melt kept New Zealand’s hydro lakes high, with total controlled storage at 97% full on 1 December 2022. This, alongside high wind and geothermal generation, allowed the electricity system to operate at near 100% renewables during times in November and December. This renewable electricity kept spot prices low – with the average December 2022 price being $17/MWh across all nodes.

Figure 2: Monthly average wholesale spot price versus daily hydro storage in 2022
In December 2019 hydro storage reached even higher levels than in December 2022, but prices remained high (see Figure 3). Large rainfall events in November and December 2019 resulted in South Island reservoirs reaching maximum capacity and hydro generators spilling water. Spot prices were expected to fall to very low levels to avoid unnecessary spilling of water. However, spot prices rose as high as $618/MWh, while the average price for the month (at the time) was $54/MWh across all nodes (see Figure 4).
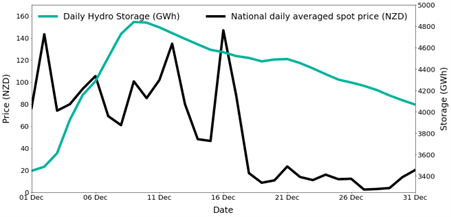
Figure 3: National daily average spot prices in December 2019

Figure 4: Monthly average wholesale spot price versus daily hydro storage in 2019
The increase of spot prices led to multiple industry participants alleging that an “undesirable trading situation” (UTS) had occurred, and that generators had breached the rules of the Electricity Industry Participation Code 2010 (Code). After further analysis and consultations, the Electricity Authority decided that the situation did indeed constitute a UTS, which spanned from 3-27 December 2019.
A UTS is a situation outside the normal operation of the electricity market that threatens, or may threaten, confidence in, or the integrity of, the wholesale market. The UTS provisions of the Code oblige the Authority to attempt to correct such situations and restore the normal operation of the market.
To rectify the situation, the Authority imposed a price cap of $13.70/MWh on the offers made in the South Island by nine different stations between 3-27 December 2022. The Authority then worked with the system operator (Transpower) and others to resettle the market, with some generators required to repay the excesses they had made during the UTS period.
Under the Code at the time, the allegation of a breach of the trading conduct rules by generators in respect of the events that led to the UTS was not upheld. This was because the safe harbour provisions in clause 13.5B of the Code applied.
In June 2021, the Authority amended the rules in the Code under which such a breach would be considered. These changes strengthen the requirements for generator offers to be “consistent with those made where no generator could exercise significant market power”, (for more on this read here) including by revoking the safe harbour provisions. The Authority also began weekly monitoring of generator offers under this rule, with reports published here.
The Authority also completed a post implementation review of the new trading conduct provisions in June 2022. Whilst nothing definitive could be proclaimed, the indicators examined found that the new provisions appear to be having the desired impact on generator offer behaviour.
23 Dec 2022
New Zealand's geography and price separation
New Zealand is a long and thin country, filled with mountains, lakes, volcanoes, cities, and vast plains. This geography impacts New Zealand’s electricity sector.
Electricity in New Zealand is transported, using the national grid, from power stations to households, businesses, and large industrial users. The largest hydro power stations are in the South Island, while the bulk of New Zealand’s electricity demand is in the North Island. The North Island also contains all of New Zealand’s thermal and geothermal power stations, and the majority of New Zealand’s wind farms.
The High Voltage Direct Current (HVDC) lines electrically link the North and South islands. These large cables mostly transport electricity produced in the South Island up to cities in the North Island.
New Zealand’s wholesale electricity market uses locational marginal pricing, where the price at each location (or node) reflects the cost of transporting electricity to that location. This means that the price at each location is different. (For a good introduction to locational marginal pricing, see Transpower’s Market 101 - Part 2 Locational Marginal Pricing.)
Locational marginal pricing occurs because of losses or transmission constraints. As electricity is transported between locations, losses occur due to heat losses on the lines. The cost of this lost electricity is included in the price at each location.
Transmission constraints occur when the electricity transported over a line reaches the maximum capacity of that line. This can be exacerbated by outages of other lines to the same location – either planned or unplanned. This congestion on the grid also results in costs of transporting electricity to a location, which are included in the locational prices.
New Zealand’s unique geography sometimes means that wholesale electricity spot prices between the islands can be quite different. This is called price separation and is the result of transmission constraints (rather than losses). If price separation occurs, there are usually lower prices in the South and higher prices in the North. This type of price separation occurred in November 2022, as seen in Figure 1.
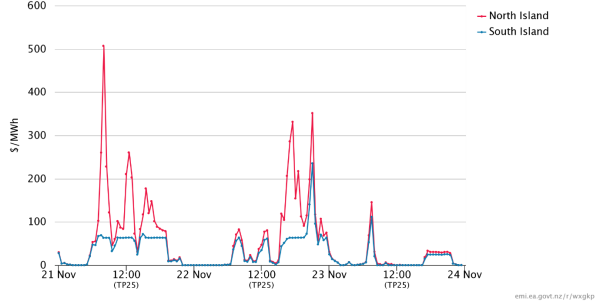
Figure 1: Half hourly spot prices for the North and South Islands, 21-23 November 2022
Price separation arose because of transmission constraints brought about by a number of contributing factors. Firstly, heavy rain in early November 2022 refilled many South Island hydro lakes. This allowed them to generate at high outputs with a low offer price[1]. It’s therefore been economic to generate a lot of electricity in the South and transport it North. This means the HVDC has been running hard – often up to the limit of what it can transfer (especially when wind has been low in the North Island).
Once this limit is reached, extra electricity for North Island demand is met using North Island generation, meaning the locational prices in the North Island will be set by more expensive North Island generation, while the lower priced South Island generation will still set the price at the South Island nodes.
The system must also carry reserves (generation on stand-by) to cover the sudden unexpected loss of the largest part of the system that could fail.[2]
Electricity and reserves are produced by the same generation stations ie, a power station can offer in both electricity and reserves for the same time period. The market then selects the optimal allocation for each power station between what it should generate and how much it should keep in reserve. This means that the need for increased North Island reserves reduces the amount of North Island generation capacity to supply electricity, which generally increases both North Island spot electricity prices and North Island reserve prices.
The HVDC can transfer reserves between the islands as well as electricity eg, it often uses cheap South Island reserves to help cover North Island generator risks. In that case it is the combination of electricity and reserve transfer that is constrained by the HVDC limit. This means that inter-island electricity and reserve transfer compete for capacity in a similar way to generator electricity and reserves, causing electricity and reserve price separation to occur simultaneously.
Another way high HVDC transfer levels can cause price separation is when the HVDC becomes the ‘risk setter’ ie, it is the largest part of the system that could fail. So, to cover the risk the HVDC poses, the North Island must have enough reserves available to cover an unexpected HVDC failure. Thus, the effective cost of using cheap South Island electricity to meet North Island demand is increased by the cost of North Island reserve.[3]
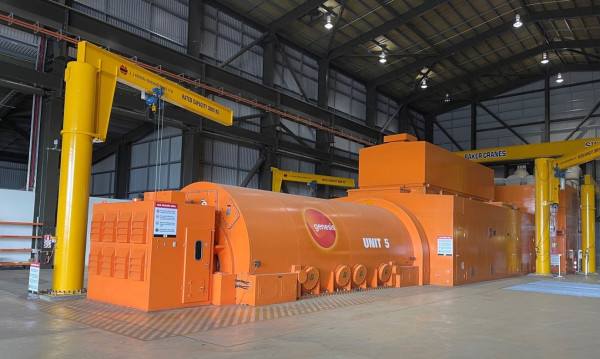
Other contributing factors to price separation during November have been North Island thermal and geothermal power station outages[4]. Geothermal power stations contribute cheap electricity, and their loss must be covered by more expensive thermal or hydro power. Also, the largest and most efficient Huntly thermal unit, Huntly 5 (see header image), was on outage with its generation being covered by more expensive thermal units. Since Huntly 5 is very large, its outage also contributed to the HVDC being the risk setter more often.
This complex spot price behaviour indicates that spot prices have reacted to changing underlying conditions. The Authority monitors spot prices, and instances of price separation, in our weekly trading conduct reports.
Image: Huntly Power Station Unit 5 uses natural gas as its fuel source and is able to generate up to 403MW of electricity.
[1] See our explainer: Spot prices fall as hydro storage increases.
[2] New Zealand’s electricity system is designed to cover the unexpected loss of the largest risk (called the ‘risk setter’), usually the biggest generator in each island or the HVDC. This is achieved by having reserves, or extra “just in case” generation, available in each island. See our explainer: Keeping the lights on with reserves.
[3] Actually, it is usually the difference between North and South Island reserve prices, not just the North Island reserve price, because increasing North Island reserve means that less South Island reserve is required to cover North Island generator risks.
[4] Read our explainer: Why do power station outages occur?
23 Dec 2022
Keeping the lights on with reserves

Why do we need electricity reserves?
Electricity is a unique product because electricity generation and consumption must match moment to moment. The System Operator sends instructions (based on an optimisation algorithm that minimises total system cost) to generators to ensure this balance is maintained, but there are always risks of unforeseen events. For example, a sudden change in electricity consumption, a transmission line getting damaged, or a generation unit failing. In order to ensure the lights stay on, there needs to be enough reserve ie, “just in case” generation capacity, to respond to an unexpected and sudden event.
The New Zealand power system runs on a frequency of 50 Hz. If electricity generation and consumption (including losses[1]) remain in balance, the frequency stays at 50 Hz. If consumption is higher than generation, the frequency will drop below 50 Hz and vice versa. The equipment on New Zealand’s grid is designed to operate in a relatively narrow band around 50 Hz and could be damaged or operate less efficiently if the frequency moves outside this band. Large thermal generating units are particularly sensitive and will disconnect from the grid to protect themselves from damage if they detect frequency outside the allowable band.
In the worst-case scenario, a drop in frequency could cause a generation unit to disconnect which could drop the frequency further, leading to a cascade of disconnections resulting in a black out. Frequency keeping reserve (FKR) and instantaneous reserve (IR) are designed to prevent such scenarios by responding to changes in frequency.
What is frequency keeping reserve?
To keep the frequency at 50 Hz, every half hour the System Operator selects one or more generators to be frequency keepers in each island. The frequency keepers monitor for small changes in frequency and adjust their generation output to keep the frequency within a small band around 50 Hz.[2] The HVDC also has controls to help balance the frequency between the islands, allowing the frequency keeping duty to be shared between generators in both islands. Frequency keeping is mainly intended to respond to small changes[3] in electricity consumption or generation (such as sudden changes in wind generation), but is not enough to respond to a large change (such as a large generation unit suddenly failing), so instantaneous reserve is also needed.
What is instantaneous reserve?
Instantaneous reserve[4] is spare capacity which can quickly respond in the event of an unexpected event which causes a large drop in frequency. This ensures the continued supply of electricity to consumers. The amount of instantaneous reserve needed is determined by the largest part of the system that could fail. This is usually either the largest generation unit that is running or the transfer across the HVDC.
Some instantaneous reserve is provided by interruptible load, for example hot water heating and some industrial processes. Interruptible load providers are paid the reserve price in exchange for allowing their load to be interrupted. However, the majority of reserves are provided by electricity generators. This is provided either by a unit generating below its full capacity[5] or a unit ready to start generating within a few seconds[6]. Instantaneous reserve can be shared between the islands if the HVDC is not the largest risk and is not running at full capacity.
How does the reserve market impact the electricity market?
Electricity and reserves are produced by the same generation stations ie, a power station can offer in both electricity and reserves for the same time period[7]. However, any capacity used as electricity cannot be used as reserve and vice versa. The market selects the optimal allocation for each power station between what it should generate for electricity and what it should keep in reserve, to keep total system costs as low as possible.
Most of the time the cost of providing spare capacity as reserve is low. However, sometimes generators need to run units inefficiently to provide reserves, so this reserve is offered at a higher price. Other times generators would miss out on high electricity prices to provide reserve, so the reserve price is increased[8] to make up the difference. Also, some units can only be used for reserves when they are generating already. This means that occasionally high-cost generation is brought on so that it can provide reserve[9] as well. Again, the reserve price increases to account for this higher electricity cost. All these mechanisms can result in spikes in the reserve price, with a recent example shown in Figure 1. Most reserve prices were below $2/MWh during the week shown, with occasional spikes up to $250/MWh in the North Island.

Figure 1: Sustained instantaneous reserve prices in the North and South Island, w/c 20 November 2022
The amount of reserve needed in each island is determined by the largest part of the system that could fail. This means that when reserve prices are high, reducing the size of this risk setter could reduce overall costs. For example, if the largest generator is 500 MW and running at full capacity, 500 MW of instantaneous reserve (IR) is needed to cover the risk. However, if the largest generator’s output is reduced to 490 MW, only 490 MW of IR is needed.
If the cost of an additional 10 MW of electricity from another generator is less than the cost of an extra 10 MW of IR, the largest generator will be asked to generate only 490 MW. This can also occur when the HVDC is the risk setter, constraining the amount of generation that can be transferred and contributing to price separation between the islands, discussed in ‘New Zealand’s geography and price separation’.
The Authority monitors both the spot energy market and reserve market in our weekly trading conduct report.
The future of reserves
Battery technology offers new solutions to both frequency keeping and reserve, as well as other ancillary services like voltage support. Meridian Energy has recently received resource consent for its 100 MW battery storage project.
SolarZero, which offers solar panel and battery services, has started offering interruptible load into the reserve market, taking advantage of installed batteries. It is likely that battery technology will become an integral part of the reserve market (and the electricity market) and could reduce reserve prices.
[1] For a description of losses, see our explainer: New Zealand’s geography and price separation.
[2] The “normal” band is 49.8 to 50.2 Hz but often a tighter tolerance is achieved.
[3] Up to around +/-30 MW.
[4] There are two types of instantaneous reserve dispatched each trading period, fast instantaneous reserve (FIR), which must be able to react within 6 seconds and be sustained for 60 seconds, and sustained instantaneous reserve (SIR), which must be available within 60 seconds and be sustained for 15 minutes.
[5] This is referred to as partly loaded spinning reserve (PLSR). Offers for PLSR take into account ramp up rate as well as total capacity. Most thermal and hydro generation units can offer PLSR, dependent on how quickly they can ramp up.
[6] This is referred to as tail water depressed reserve (TWDR) and is offered by some hydro generation units. It involves running the unit like a motor without water flowing through the turbine. The control gates can be quickly opened to allow water to pass through the turbine and generate electricity if needed.
[7] Interruptible load providers offer only into the reserve market.
[8] The market clearing engine automatically increases the reserve clearing price to account for this lost opportunity (ie, opportunity cost) of generating electricity.
[9] Partially loaded spinning reserve.
18 Nov 2022
When do power station outages occur?
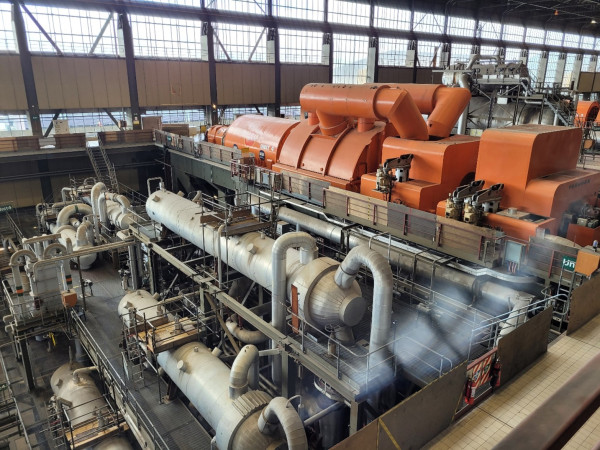
Figure 1: Genesis's Rankine Unit 4 at Huntly Power Station being prepared for outage (26 October 2022)
Electricity in New Zealand is generated by hydro dams, geothermal and thermal power stations, and wind farms. Some of these power stations were built recently, like the Waipipi wind farm in Taranaki which was completed in 2021. Others are over 60 years old, like the Roxburgh dam in Central Otago. Maintaining each power station is critical - power stations cost millions to build and generate the electricity that facilitates modern life across Aotearoa.
Power stations have regular outages for planned maintenance or to be recertified. Power stations also have unexpected outages when equipment fails. Most planned outages occur during summer when demand is low and less electricity generation is needed. During winter, minimal planned outages occur, as high demand requires more electricity generation.
Many South Island hydro outages are planned to align with New Zealand’s annual inter-island transmission cable outage in February. This cable outage reduces electricity transfer between the North and South Islands for about one week.
Figure 2 shows New Zealand’s average daily generation outages from 2013 to 2022. In 2020 the inter-island transmission cable outage moved from November to February and so outage volumes moved respectively.
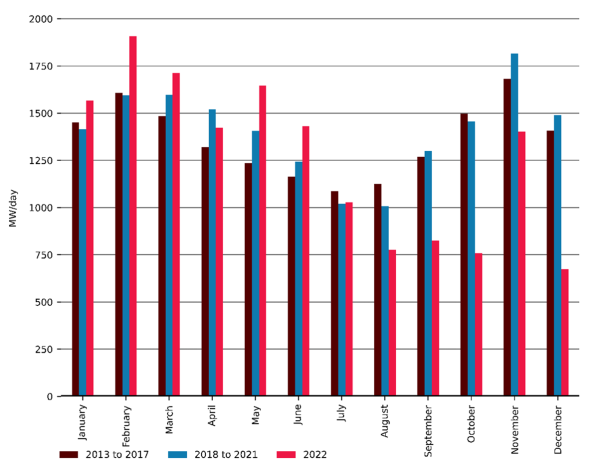
Figure 2: Average daily generation outages (MW/day) by month, from 2013-2022 (scheduled in Transpower’s POCP customer portal)
Outages in 2022 differed slightly from previous years - outages through to June 2022 were high, but then fell below historic levels from July. This likely arose from the following factors:
- The Clutha Upper Waitaki Lines Project (CUWLP) upgraded transmission lines between the Clutha and Upper Waitaki, which enabled more generation from the Manapōuri, Clyde and Roxburgh dams to be transferred northwards. Some South Island hydro generators coordinated their outages with nearby transmission outages related to CUWLP.
- COVID-19 delays may have shifted scheduled outages from 2020/2021 into early 2022.
Next year, the inter-island transmission cable outage will occur between 23 February and 6 March 2023. So, parts of the Manapōuri, Benmore, Aviemore and Takapō hydropower stations have scheduled maintenance outages at this time.
The electricity sector coordinates outages through Transpower’s POCP portal. Generators log outage start and end dates and the amount of unavailable generation. Transpower uses POCP data for the New Zealand Generation Balance (NZGB) which predicts situations where simultaneous outages could pose a risk to the supply of electricity, especially if demand is forecast to be high.
Transpower’s calculations on NZGB, based on the current schedule of outages, show a good buffer of electricity supply compared to forecast demand for the rest of this year and first half of next year. Transpower regularly update these calculations as more information becomes available.
The Electricity Authority actively monitors trading conduct as part of the new trading conduct provision which came into effect on 30 June 2021. This includes monitoring generation outages to ensure participants comply with trading conduct rules.
10 Nov 2022
Hydro lakes, dry summer risk and spot electricity prices
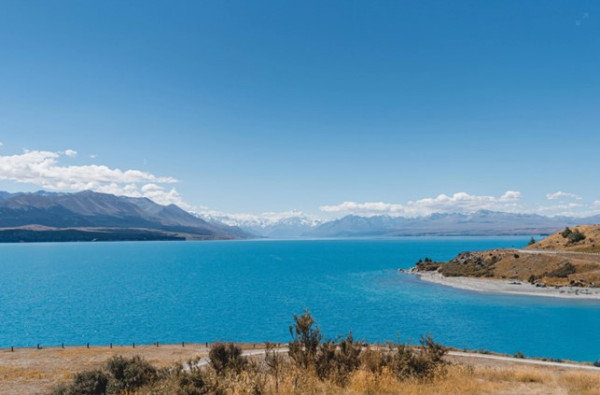
Lake Tekapō
In New Zealand most electricity is generated by hydro dams, with the majority of these located in the South Island. Many dams have storage reservoirs which hold water for future use.
Storage in each hydro lake depends on the difference between inflows - either rain and snowmelt - and outflows – the water used in generating electricity. If a hydro dam consumes more water from the reservoir than is refilled by inflows, hydro storage decreases.
While New Zealand’s hydro lakes are large enough to see from space, their hydro reservoir capacity is surprisingly small - since there are limits on minimum lake levels. When all hydro reservoirs are full, the stored energy amounts to approximately five weeks of electricity generation over winter[1]. This makes managing hydro storage critical to the electricity sector.
New Zealand had its wettest winter on record in 2022[2], resulting in above average hydro storage. In spring, however, inflows at many lakes were below average. These low inflows, coupled with high hydroelectricity generation, caused hydro storage to fall across all the major lakes.
The outlook for summer 22/23 is for La Niña conditions, similar to the previous two summers. During La Niña, New Zealand tends to experience warm and wet conditions in the North and dry conditions in the South[3].
Anticipating another La Niña summer, many generators began to conserve water in early September. This was achieved by placing more hydroelectricity in higher cost offer tranches in the wholesale electricity market. This manifested in higher average spot prices in September and October.

Figure 1: Weekly averaged national spot electricity prices and daily national hydro storage, 12 July – 6 November 2022
Figure 1 shows national hydro storage levels and the national average weekly spot electricity price between 12 July and 6 November 2022. The yellow area shows how, when storage was increasing, there were more instances of weekly average spot prices below $50/MWh. However, when storage began decreasing, weekly average spot prices were higher, as per the blue area.
During the first week of November, there was heavy rain and large hydro inflows for lakes in the South Island. Weekly average spot prices decreased to $16.7/MWh, see red area in Figure 1.
Near-term forward electricity prices are also sensitive to storage levels, as rain events provide confidence for higher storage for the near future. The first week in November was no exception, with near-term forward prices[4] falling by around $15/MWh.
Find out more on the Electricity Authority’s EMI website – see electricity spot prices, forward prices and hydro storage plots.
[1] A 100% renewable electricity generation system for New Zealand utilising hydro, wind, geothermal and biomass resources - ScienceDirect
[2] https://niwa.co.nz/climate/summaries/seasonal/winter-2022
[3] El Niño and La Niña | NIWA
[4] Our explainer on forward prices can be found here: Eye on Electricity: The forward electricity market explained — Electricity Authority (ea.govt.nz)
02 Nov 2022
Snowmelt: A seasonal boost to hydro lake levels
Why is snowmelt vital to the generation of New Zealand’s electricity? What does it mean for hydroelectric power?

In New Zealand, between 80-95% of electricity is generated by renewable sources, with the majority produced by hydro dams. Most dams are in the South Island and their electricity is ferried to the North Island via large cables (called the High-Voltage Direct Current or HVDC).
The additional water used in dams (hydro storage) is refilled by both rain and snow, with snow having a particularly strong seasonal impact on storage. Hydro lake levels typically drop during autumn and winter, as hydro generation runs hard and rain falls as snow on the slopes of the Southern Alps. Then snowmelt flows into the hydro lakes in spring and summer. This snowmelt contributes to between 20-70% of spring and summer water inflows[1] in the South Island’s hydro lakes.
There are three main water catchments in the Southern Alps, the:
- Waitaki river, which feeds hydro dams like Benmore and Aviemore;
- Clutha river, which runs through the Clyde and Roxburgh dams; and
- Waiau river, which flows through the Manapōuri Power Station.
Snow typically accumulates at elevations above 1,000 metres, so the first two catchments experience more snowmelt as their mountains are higher.
New Zealand experienced its wettest winter on record in 2022. In late October 2022, national hydro storage was 23% percent above the historic mean ie, the lakes were high, when typically, they would be low. Hence, snowmelt - combined with already high lake levels - could see high hydro storage persist at lakes Pūkaki, Hawea and Takapō throughout the remainder of the year.

Figure 1: Estimated seasonal snow storage in the Waitaki catchment, 1 April - 22 October 2022
Figure 1 shows an estimate of snow storage in the Waitaki catchment up to 22 October 2022, produced by Meridian Energy. Meridian estimate that the Waitaki catchment has ~1,500 GWh of snowmelt in the catchment on 22 October 2022, which is above the 75th percentile. Lakes with less snowmelt, however, like Manapōuri and Te Anau, could remain with low hydro storage, especially as NIWA are forecasting normal or below normal rainfall[2].
Figure 2 below shows storage at New Zealand’s main hydro storage lakes in 2022, alongside the historic mean and 10th and 90th percentiles of lake levels.
Snowmelt is vital to New Zealand’s electricity generation. Ongoing work seeks to improve our understanding. This online tool visualises where precipitation anywhere in the world will flow. For example, see this example of a raindrop (or snow flake) falling in the Southern Alps, and how this snow fall eventually runs out along the Clutha river through the Clyde and Roxburgh power generation dams. The NIWA website also displays snow depth across different mountains in New Zealand.
The Electricity Authority monitors hydro storage and how it changes throughout the year. Current and past national hydro storage levels can be found at Electricity Authority - EMI (market statistics and tools) (ea.govt.nz).
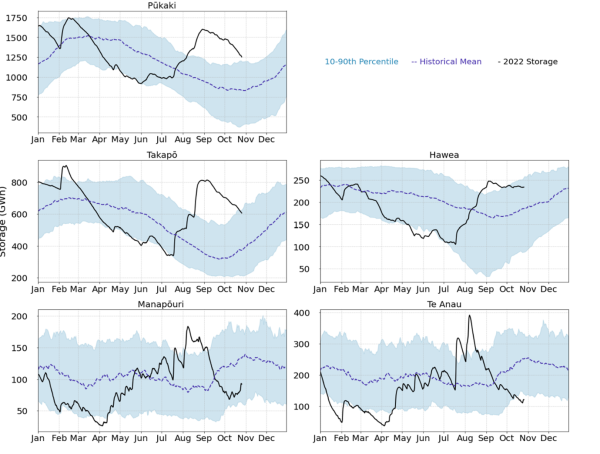
Figure 2: Hydro storage at major South Island hydro lakes in 2022, alongside the historic mean and 10th and 90th percentiles between 1926 and 2021
[1] Nottage-et-al.-2010.-CC-Adaptation-In-NZ.pdf (climateandnature.org.nz)
[2] Seasonal climate outlook September - November 2022 | NIWA
25 Oct 2022
Changing winds: how wind energy interacts with the New Zealand power system
Electricity in New Zealand is generated from hydro dams, wind farms, geothermal power stations and thermal power stations, which run on coal, gas or diesel. A small percentage of electricity is also generated from solar farms and co-generation[1].
The majority of New Zealand’s electricity (60-70%) comes from hydro dams - with the largest dams located in the South Island. Many dams have storage, which save water for future use. This allows hydro dams to ramp up and down generation to match electricity demand. Geothermal generates another 15-20% of Aotearoa’s electricity. It produces electricity at a near constant rate and cannot adjust its output.
Wind farms generate between 5-10% of New Zealand’s electricity. Wind generation has no flexibility[2] and is dependent on how the wind is blowing, meaning the electricity market must react to its fluctuating output. Other sources of electricity, like hydro and thermal, must either make way or make up for wind.
There is currently 1.04GW of wind generation installed in New Zealand, which is about 10% of New Zealand’s total capacity. The largest wind farms are in South Taranaki and the Tararua ranges, with others in Otago, Southland and Wellington.
Wind generation is as tricky to forecast as wind itself, and sometimes an accurate prediction only materialises a few hours in advance. Currently, wind and thermal generation are inversely related. If wind generation is high, thermal generation is generally low and vice versa.
The influence of wind on electricity spot prices and thermal generation can be seen in Figure 1, which shows the spot price between 3-4 October 2022, alongside wind and thermal generation. On 3 October alone, wind fluctuated from roughly 50MW in the morning to over 700MW by the evening. The nationally averaged spot price rose close to $250/MWh when wind was low and thermal generation was high. Prices then dropped to roughly $5/MWh when wind was high and thermal generation was lower.

Figure 1: Wind and thermal electricity generation and the half hourly spot price between 3-4 October 2022
As more wind farms are built, ever improving wind prediction will allow the flexible system surrounding wind generation to react to its fluctuating power output. In a 100% renewable future, hydro generation, and potentially demand response, grid scale batteries and thermal generation - fuelled using biomass - will support wind, instead of fossil fuelled thermal generation.
The Electricity Authority recently released a paper discussing how around 400-500MW of investment in new supply or demand response will be needed every year until 2050 to help meet New Zealand’s renewable electricity goals.
The Electricity Authority monitors wind generation, see our weekly Trading Conduct Reports and Quarterly Reports.
11 Oct 2022
Eye on Electricity: The forward electricity market explained
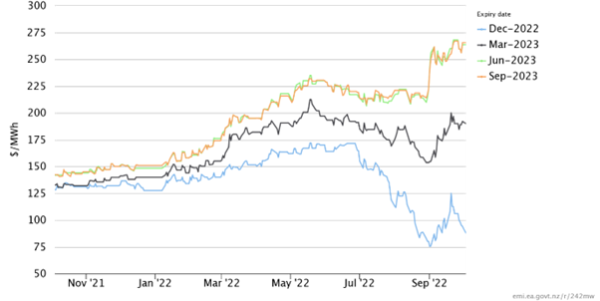
Figure 1: Short-dated forward prices, 4 October 2021 – 3 October 2022
Why do we have a forward electricity market?
Electricity in New Zealand is sold from generators to buyers[1] every 30 minutes via auctions. These buyers must pay the electricity spot price, explained in Eye on Electricity #2, which changes every auction to reflect underlying market conditions.
The forward electricity market (or electricity futures), however, allows electricity buyers to purchase a forward contract. This contract protects buyers against volatile spot prices by fixing their electricity price for a specified period. This creates more certainty in the market, as electricity buyers (sellers) will have more stable costs (earnings).
How are forward prices determined?
Forward prices reflect expectations of future electricity demand and generation costs. These prices are determined by market buyers and sellers and therefore represent the consensus view of future prices.
Forward price contracts for New Zealand electricity can span a period of months or quarters. This reflects the extent the contract covers. Contracts ending within a year are dubbed ‘short-dated’ contracts, while those extending over a year are called ‘long-dated’ contracts.
What influences forward prices?
Current and projected market conditions impact forward electricity prices. Hydro storage, as explained in Eye on Electricity #1, tends to heavily impact short-dated future prices, making them potentially more volatile than long-dated future prices. High hydro storage depresses spot prices as abundant hydroelectricity can be offered cheaply into the market. So the cost of short-dated forward prices tends to fall as hydro storage increases.
Figure 1 shows short-dated forward electricity prices as of 3 October 2022. The December 2022 contract price began declining in early July 2022, as hydro storage began increasing (see vertical blue line). This indicates that high hydro storage is likely to keep spot prices depressed through to December 2022. The March 2023 contract price dipped slightly as hydro storage increased, however it has since increased again. The cost of the June and September 2023 quarter contracts did not react to increasing storage, as these were unlikely to be impacted by high hydro storage.
Other factors which can impact forward prices are seasonal climate expectations, namely the possibility of either an El Niño or its sister La Niña. The El Niño-Southern Oscillation can affect the electricity industry at both ends of the spectrum, by changing expected demand patterns and weather systems, which impacts both hydro and wind generation.
Industry participants can also impact forward electricity prices with corporate announcements. For example, in July 2020 when Rio Tinto announced that the Tiwai Point aluminum smelter (which is New Zealand’s largest electricity consumer[2]) would cease operating, forward prices declined sharply. This reflected an expectation that more electricity would be available in the market after its closure. However, when in January 2021 it was announced that Tiwai Point would remain open, forward prices bounced back up.
In late August 2022, Genesis[3] launched their Market Security Option. This indicated an expectation of rising thermal fired electricity generation costs, and subsequently forward prices increased, as seen in Figure 1 (see vertical red line for the announcement date).
The Electricity Authority monitors the forward electricity market and publishes commentary in each quarterly report, which can be found here. Readers can find interactive plots showing how forward electricity prices are changing at: Electricity Authority - EMI (market statistics and tools) (ea.govt.nz).
[1] Both retailers, who buy electricity on the behalf of consumers, and large industrial electricity users.
[2] Consuming roughly 12% of New Zealand’s electricity.
[3] A company which operates many New Zealand power stations.
04 Oct 2022
Southern lakes and spot prices: declining lake levels at Te Anau and Manapouri
How hydro storage has impacted prices in winter 2022
New Zealand experienced its wettest winter on record in 2022[1]. This rain filled New Zealand’s hydro reservoirs, which store water for electricity generation. In late August 2022, when the lakes were collectively at their fullest, national hydro storage was at 157% of the historical average. This abundance of water caused lower electricity spot prices, as explained in Eye on Electricity #1, as hydroelectricity was offered into the wholesale electricity spot market at low prices.
Recent changes to Lakes Manapōuri and Te Anau
Hydro storage remains healthy across the country at 145% of the historic average[2], but this average obscures storage at individual lakes. As shown in Figure 1, lakes Pūkaki, Takapō, Hawea and Taupō remain above their 90th historic percentile[3], whilst Manapōuri and Te Anau have fallen below their historic means. These two lakes feed New Zealand’s largest hydro dam, the Manapōuri Power Station, which has a capacity close to 850 MW.
Nationally, inflows in September 2022 have been 112% of historic inflows, while at Manapōuri and Te Anau, inflows have been roughly half of historic inflows. These lower inflows have been compounded with Manapōuri running close to capacity for much of September, see Figure 2. The combination of lower inflows and high running has resulted in storage at lakes Manapōuri and Te Anau declining faster than the other hydro lakes.
How changes in storage affects spot prices
With storage at Manapōuri and Te Anau now below their respective historic means, the electricity offers from the Manapōuri power station have changed. When the lakes were higher, more electricity was offered in the lower priced tranches. On 31 August 2022, all Manapōuri generation was offered below $10/MWh. While on 25 September 2022, roughly 45-70% of offers were priced below $10/MWh.
This change in offers reflects the shift from managing Manapōuri’s risk of spilling and wasting water, to managing the risk of depleting the remaining storage. Higher offers results in the station generating less electricity, which saves water, but leads to higher spot prices.
With more of Manapōuri’s hydroelectricity now priced in the higher tranches, more trading periods now have spot prices around $100/MWh and there are fewer instances of very low prices. This shows how quickly the electricity market reacts to changing underlying conditions, with the drawdown of just two lakes impacting daily spot prices.
The Electricity Authority monitors trading conduct in the electricity spot market. View our weekly Trading Conduct reports here.
[1] Winter 2022 | NIWA
[2] As of 29 September 2022.
[3] This indicates when lake levels are extraordinarily high. Only 10% of years between 1926 and 2021 had storage levels higher in September than the 90th percentile.
27 Sep 2022
Electricity price volatility: an emerging feature in an increasingly renewable market

Figure 1: Nationally averaged half hourly spot prices, daily average spot prices and inflation adjusted historical average spot prices, 5-9 September 2022
What is spot pricing?
Electricity in New Zealand is sold in a wholesale market via auctions every 30 minutes. These 30-minute intervals are called ‘trading periods’. Generators (who produce electricity) offer a particular amount of electricity at a certain price to retailers (who purchase electricity on behalf of their customers).
The System Operator (Transpower) controls each auction and accepts all offers that combine to meet the expected demand. The cost of the final offer accepted sets the ‘spot price’. Every offer accepted is then paid the ‘spot price’ for their electricity.
What is spot price volatility?
Electricity spot prices change depending on the underlying market conditions. During times of high hydro and wind electricity generation and/or when demand is low, spot prices can fall as low as $0.01/MWh. If demand increases and/or intermittent generation from wind farms drops off, spot prices can suddenly spike. This rapid fluctuation is called ‘price volatility’.
What happened to spot electricity prices in September?
At the start of September spot prices were volatile. High amounts of hydro generation, combined with high wind and low demand meant that spot prices, at times, were as low as $0.02/MWh. This is shown in Figure 1 as the relatively flat half hourly spot price (orange line). A cold snap affected New Zealand between Monday 5 and Thursday 8 September 2022. The lower temperatures pushed up electricity demand as people used more electricity to keep warm.
Between the morning of Monday 5 September and the morning of Thursday 8 September, nationally averaged half hourly spot prices spiked at over $800/MWh. The highest spot price was over $1,600/MWh on Tuesday at 6:30pm, as shown in Figure 1.
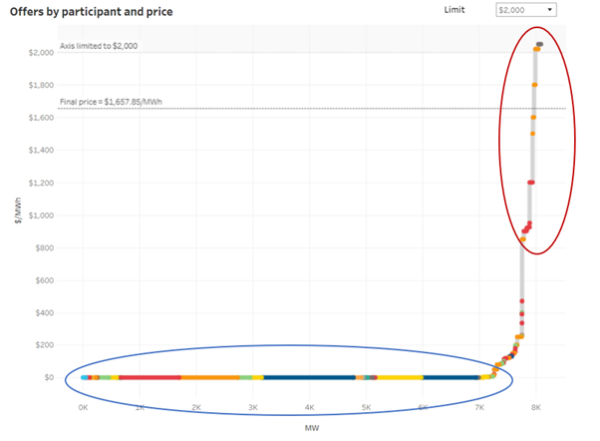
Figure 2: Price offer curve for 6:30pm on Tuesday 6 September 2022
What causes spot price volatility?
The offer curve shows all the electricity offers for a particular trading period. An offer curve is shown in Figure 2. The x-axis is the megawatt (MW) amount of electricity in each offer, while the y-axis is the cost of that electricity in $/MWh. Cheap electricity sits close to the $0/MWh, see the blue circle in Figure 2, while more expensive electricity sits further up, see the red circle in Figure 2. The steepness of the offer curve affects price volatility.
Currently the offer curve is steep. New Zealand has a large pool of renewable electricity generation which hovers around the bottom of the offer curve. When demand is relatively low, this generation can be dispatched to meet forecast demand. This leads to low prices, as one doesn’t need to ‘climb the offer curve’ to meet demand. More expensive thermal electricity generation sits further up the curve. When demand increases, and or intermittent generation decreases, the System Operator must start dispatching offers higher up the curve.
Figure 2 shows the offer curve for 6:30 pm on Tuesday 6 September 2022 when electricity demand was high. The dotted horizontal line in Figure 2 shows the spot price for that trading period, which was over $1600/MWh. This line is where electricity offers added up to expected demand.
A steep offer curve means that small changes in electricity demand or renewable generation can cause large swings in the spot prices, as more expensive thermal generators, which are further up the offer curve, set the ‘spot price’.
In the aggregate, however, the price swings seen at the start of September average out to roughly the same daily average as seen historically. See Figure 1, the black dashed (inflation adjusted historical average) and blue line (daily average spot price for 5-9 September 2022).
Increased price volatility is expected as the electricity grid becomes more renewable
Wholesale electricity price volatility is expected to become more common as New Zealand builds more intermittent electricity generation. Periods with abundant water, wind and sunshine will see extended periods of low electricity prices. Then when renewable sources of electricity aren’t enough, thermal sources will cover the difference, causing spot prices to spike.
Households and small businesses are protected from price volatility by paying a fixed cost for electricity. In an intermittent and sustainable future, it will be increasingly important for electricity industry participants to ‘hedge’ themselves against price volatility.
13 Sep 2022
Eye on Electricity: how hydro storage impacts spot prices
What influences spot pricing and hydro storage? Read on to find out
Clyde dam, Central Otago
What is spot pricing?
The ‘spot price’ of electricity is the wholesale price. Electricity in New Zealand is sold via auctions every 30 minutes. Generators (who produce electricity) offer a particular amount of electricity at a certain price to retailers (who purchase electricity on behalf of their customers).
The electricity System Operator (Transpower) controls each auction and accepts all offers that combine to meet the expected demand. The final offer accepted sets the ‘spot price’. Every offer accepted is then paid the ‘spot price’ for their electricity.
What influences spot pricing?
The spot price depends on supply and demand within the electricity market. The key factors are the expected demand for electricity and the cost of producing the electricity eg, what proportions of hydropower, wind and thermal fuels are used. If a lot of renewable resources are used, like hydro and wind, then spot prices tend to be lower as they are cheaper sources of electricity. If more gas and coal is used, then spot prices will be higher as they are expensive to run.
The weather has a large impact. It influences the supply of low-cost renewable electricity generation eg, the amount of rainfall for hydro reservoirs and windspeed for wind farms. The weather also influences the demand for electricity, with a cold snap pushing up demand and increasing spot prices, while hotter weather sees demand and spot prices drop.
How does hydro storage influence spot prices?
Hydro generators have reservoirs that store water behind a dam for electricity generation. When reservoir levels are high, hydro storage increases and pushes the spot price of electricity down. When reservoir levels are low, spot prices tend to be higher to help conserve water.
How has hydro storage performed this year?
Hydro storage has fluctuated this year, see the blue line in Figure 1. In January 2022 hydro storage declined sharply as there was a net outflow of water from hydro reservoirs. Yet in February there was a steep increase in hydro storage due to high rain flow. This was followed by a near constant decline in hydro storage until June from dry weather conditions and correspondingly low reservoir levels.
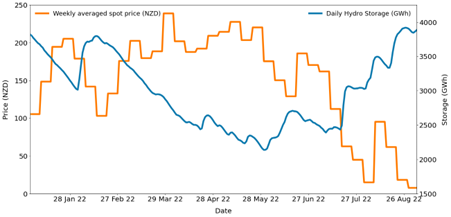
Fig 1: Weekly averaged national spot prices and daily hydro storage for 2022
How has hydro storage influenced spot prices this year?
The dry weather experienced between February and June meant that less low-cost hydro generation was offered into the wholesale electricity market, as generators wanted to conserve water for winter. Instead more thermal generation was used to meet electricity demand eg, coal and gas. This caused the average electricity spot price to be $181/MWh (1 January - 31 May 2022).
From early June onwards, rainfall refilled the hydro lakes and prices fell due to the abundance of low-cost hydro generation, despite demand being higher than during the summer. At times, storage was so high generators were forced to spill water (see picture). The average electricity spot price was $97.5/MWh (1 June - 5 September 2022).
29 Aug 2022
Spot prices fall as hydro storage increases
The heavy rain that has lashed the country in recent times may have caused flooding and numerous slips in parts of the country but there has been one upside – storage in New Zealand’s hydro schemes has risen rapidly.
As of August 25, hydro storage was sitting at 77 per cent of the theoretical maximum storage – at 3400GWh up 28 per cent on the same time last year.
As the lakes levels have risen, prices on the spot market have fallen because of the abundance of available hydro generation as seen in Figure 1.

Fig. 1: Weekly average spot price Otahuhu relative to Hydro Storage April-August 2022
The decline in spot prices relative to the abundance of hydro storage contrasts with the events of December 2019 when spot prices remained elevated despite hydro storage increasing, as seen in Figure 2.

Fig. 2: Weekly average spot price Otahuhu relative to Hydro Storage October-December 2019.
Following a year-long investigation after a claim made by seven claimants, the Authority decided there was an undesirable trading situation for the period between 3-27 December 2019 and reset prices for the period of the UTS to a level that was more consistent with the abundance of water available for generation.
The Authority introduced new trading conduct rules in June 2021 and is actively monitoring trading conduct behaviour.
The recent high inflows into hydro lakes as also impacted on the futures market with Forward Electricity Market prices falling for the remainder of 2022 as seen in Figure 3.

Fig. 3: Forward Electricity Market prices 26 May-17 August 2022
More articles